


Tariq Saeedi
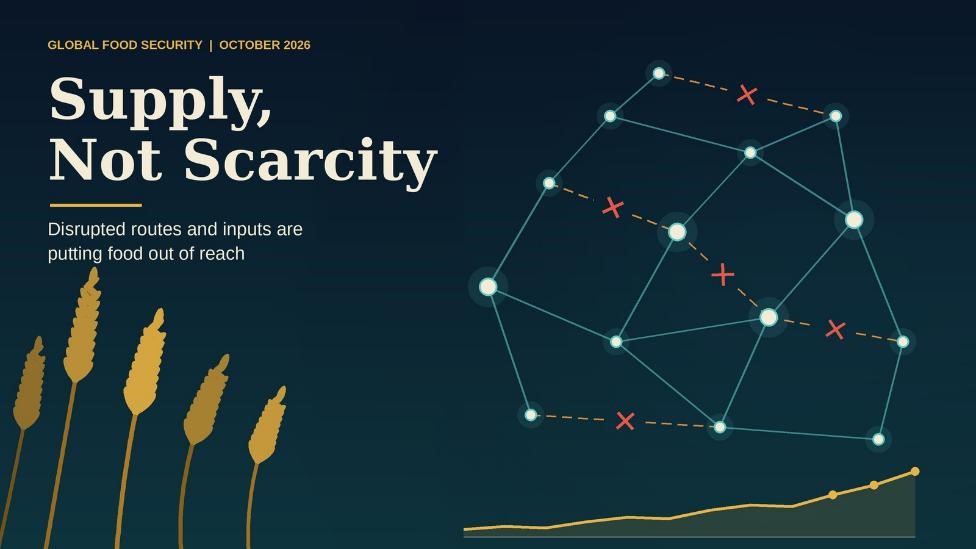
The world is growing enough food. What is failing is the movement of it and the inputs that produce it: grain cargoes at sea, fertilizer through a narrow strait, aid pipelines short of funds.
The result is a rising price signal and a widening gap between food that exists and food ordinary households can buy.
At a glance
| Indicator | Latest figure | Source |
| FAO Food Price Index, September 2026 | 136.0 points, +5.8% on a year earlier | FAO |
| FAO Cereal Price Index, September 2026 | 122.8 points, +17.2% on a year earlier | FAO |
| World cereal production, 2026 | 2,979 million tonnes, 2.1% below the 2025 record, second-largest ever | FAO |
| World cereal stocks, end of 2026/27 | 950.0 million tonnes; stocks-to-use ratio 31.7% (32.0% a season earlier) | FAO |
| World cereal trade, 2026/27 | 505.8 million tonnes, down 18.3 million (3.5%) | FAO |
| Black Sea share of seaborne grain | About 14% of volumes, from 3% of dry-bulk exports | BIMCO |
| Fertilizer trade exposed to Hormuz | About one-third of seaborne fertilizer trade | IFPRI |
| Urea price, April 2026 | Above $850 per tonne, up 80% since February | World Bank |
| Acute food insecurity, 2025 | 266 million people in 47 countries | Global Report on Food Crises |
| Chronic hunger, 2025 | 645 million people (7.8% of the world) | SOFI 2026 |
| People unable to afford a healthy diet | 2.7 billion | SOFI 2026 |
| People facing severe hunger in 2026 | 318 million; WFP expects about half the $13 billion needed | WFP |
Read together, the production, stocks and trade rows show a world with ample grain, while the Black Sea, fertilizer and urea rows show why it is not reaching everyone: the cost and reliability of moving it, and of growing the next crop, have shifted sharply.
The price signal
FAO’s index averaged 136.0 points in September 2026, up 2.0 points (1.5%) on a revised August and 7.4 points (5.8%) above a year earlier. It was the third monthly rise in a row. Crop-based groups led it; meat eased and dairy was flat.
| FAO index | Sept 2026 | Change on August | Change on Sept 2025 |
| Food Price Index | 136.0 | +1.5% | +5.8% |
| Cereals | 122.8 | +5.1% | +17.2% |
| Vegetable oils | 198.6 | +0.9% | +18.3% |
| Sugar | 114.0 | +6.1% | +14.7% |
| Meat | 127.9 | -1.1% | in line |
| Dairy | 119.1 | -0.1% | -19.1% |
Inside cereals: wheat prices rose 6.3% in the month to their highest since August 2023. Maize rose 5.6% to a three-year high, sorghum 13.7%, barley 3.9% and rice 1.4%. FAO attributes the wheat and maize moves largely to logistical constraints in the Black Sea region, which pushed importers towards other origins, and to uncertainty over shipping through the Strait of Hormuz, which kept fuel, fertilizer and freight costs elevated.
Inside vegetable oils and sugar: palm oil rose for a fourth consecutive month on strong import demand and dry-weather concerns in Southeast Asia. Sugar, up for a third consecutive month, reached its highest level since April 2025 on smaller expected crops in the European Union and Thailand, and on concerns over rainfall in India as El Niño strengthens.
Context: the index is still 15.1% below its March 2022 record. The concern is direction and breadth, not level. FAO’s chief economist said that if the pressures persist, they will soon pass through to consumer prices, especially in countries that import food and energy.
A harvest that exists but cannot move: the Black Sea
The Black Sea and Sea of Azov handle about 3% of global dry-bulk seaborne exports but roughly 14% of seaborne grain volumes (BIMCO). Attacks on ships, ports and terminals escalated on 6 July 2026, and shipowners have since pulled back from the region’s ports.
| Measure | Figure | Source and date |
| Global grain shipments, weeks 29-33 | -8% year on year | BIMCO, 25 Aug |
| Black Sea grain exports, same weeks | -26% year on year | BIMCO, 25 Aug |
| Export capacity out of service | Estimates range from about one-third (a major exporter’s farm union) to over 97% (a trade report on Azov and Black Sea capacity) | Aug 2026 snapshots |
| Freight, deep-sea Black Sea port to Egypt | About $70 per tonne asked by shipowners | S&P Global, 20 Aug |
| One major exporter’s August wheat shipments | 1.8 million tonnes, the lowest August since the 2010 export ban | S&P Global, 20 Aug |
| Share of a major exporter’s grain exports that left via three southern ports | More than 90% | Reuters via Marine Insight |
| Black Sea crude and product flows | Tanker volumes could fall 3% if reduced flows persist | BIMCO, 5 Aug |
| World cereal trade, 2026/27 | 505.8 million tonnes, down 3.5%; cut by 3.5 million tonnes in a month | FAO, 2 Oct |
Alternatives are real but small. Cargoes are being redirected to Baltic, Caspian and Far Eastern ports and to overland routes. BIMCO and FAO both say these cannot replace the volumes lost, and FAO cites insufficient alternative transport capacity behind its latest downgrade of wheat and maize trade.
Stocks are not the issue. FAO puts world cereal stocks at 950.0 million tonnes at the end of 2026/27, a stocks-to-use ratio of 31.7%, and says wheat carryovers have been revised up for several exporters because export expectations were cut. Grain is being held back, not used up.
Who pays: importers that relied on short, cheap Black Sea voyages now buy from more distant origins at higher freight and insurance cost. That cost lands first in the import bills and bread prices of countries with weak currencies and thin foreign-exchange reserves.
The input shock: fertilizer, energy and the Strait of Hormuz
The second disruption sits upstream of the harvest. Between 1 and 16 March 2026, Lloyd’s List Intelligence counted 77 vessel crossings of the Strait of Hormuz, against 1,229 in the same period a year earlier. The strait carries inputs that decide next season’s yields.
| Measure | Figure | Source |
| Share of seaborne fertilizer trade through the strait | About one-third | IFPRI |
| Share of global flows by product | Urea about 35%; ammonia over 25%; phosphates about 20%; sulfur about 45% | IFPRI-AMIS |
| Annual export capacity cut off | About 21 million tonnes of urea; about 4 million tonnes of DAP | IFPRI |
| Urea price, April 2026 | Above $850 per tonne; +80% since February; highest since April 2022 | World Bank |
| Urea and DAP, through April | Urea roughly doubled; DAP up about 35% | IFPRI |
| World Bank fertilizer price index | +12% in Q1 2026; highest since October 2022 by April | World Bank |
| 2026 projections | Fertilizer index above +30%; urea nearly +60%; DAP nearly +6%; potash about +12% | World Bank |
| Farmers’ fertilizer affordability | Weakest since mid-2022 | World Bank |
| Easing expected in 2027 | DAP about -10%; potash about -6%, if exports recover and gas prices moderate | World Bank |
Why it matters for food: the World Bank judged in May that a fertilizer shock, more than a food-price spike, was the greater near-term threat to crop yields, because farmers who cannot afford inputs apply less. Its 2026 spike is smaller than the 2021 and 2022 jumps (more than 100% and 55%), for three reasons: northern-hemisphere growers had already bought much of their supply, gas prices rose less sharply, and Middle East trade is being rerouted through land corridors.
Policy can amplify or soften it. IFPRI modelling shows that decisions by major exporters outside the Gulf matter as much as the strait itself:
- Removing about 3.5 million tonnes of urea from trade, 7% of the total, would add about $134 per tonne to urea and $224 per tonne to DAP.
- Returning about 6.1 million tonnes of urea to the market would bring urea back below pre-crisis levels by early 2027.
- Export restrictions protect domestic users but shrink world supply; the pattern was seen in grain in 2022 and in rice in 2023.
Other chokepoints add to it. WFP described a rare “dual chokepoint” in March, with Red Sea shipping already strained and Hormuz now added. Suez Canal traffic was still about 60% below 2023 levels in early January 2026 (BIMCO), and a maritime embargo declared on ports and ships in the southern Red Sea area in the summer raised the risk again (Marine Link, 5 August).
Who bears the cost
The shocks land on a system that had been improving slowly and has little slack. Chronic hunger fell for a third year in 2025, which is the progress now at risk. Acute hunger, the kind that needs emergency food, is already high and concentrated.
| Measure | Figure | Source |
| People facing chronic hunger, 2025 | 645 million (7.8%), against 8.1% in 2024 and 8.6% in 2022; 14 million fewer than in 2024 | SOFI 2026 |
| Moderate or severe food insecurity, 2025 | About 2.1 billion people (25.8%) | SOFI 2026 |
| Unable to afford a healthy diet | 2.7 billion | SOFI 2026 |
| Hunger by region, 2025 | Africa 309 million, Asia 292 million; Africa is now the larger for the first time | SOFI 2026 |
| Children under five with stunting | About 150 million | SOFI 2026 |
| Hunger projected for 2030 | 510-520 million with higher energy and fertilizer costs, against 503 million before the Middle East conflict | SOFI 2026 |
| Acute food insecurity, 2025 | 266 million people (22.9% of those analysed) in 47 countries and territories | GRFC 2026 |
| In the most severe phase (Catastrophe) | 1.4 million people, more than nine times the 2016 level | GRFC 2026 |
| Where conflict is the main driver | 147.4 million people in 19 countries, up from about 74 million in 21 countries in 2018 | GRFC 2026 |
| Where economic shocks are the main driver | Almost 30 million, up from about 10 million over eight years | GRFC 2026 |
| Children acutely malnourished, 2025 | 35.5 million, including about 10 million with severe acute malnutrition | GRFC 2026 |
| Forcibly displaced in food-crisis contexts | More than 85 million | GRFC 2026 |
| Hunger Hotspots, June-November 2026 | 13 hotspots expected to worsen; famine risk in four countries or territories; conflict a driver in 12 of 13 | FAO and WFP |
| People facing severe hunger in 2026 | 318 million, 41 million of them at emergency level or worse | WFP |
| WFP plan for 2026 | Prioritize 110 million people at a cost of $13 billion; expects about half | WFP, Nov 2025 |
A note on the numbers: the GRFC cautions that the fall from the 2023 peak of 282 million partly reflects reduced data coverage, not real improvement. In 2025, famine conditions were confirmed in parts of two crisis areas.
The common thread is cost, not quantity. The 2.7 billion who cannot afford a healthy diet live in a world holding 950 million tonnes of cereal stocks. A price rise that looks modest in a global index can mean fewer or poorer meals where most of a household budget goes on food.
Weather on top: the El Niño outlook
A strengthening El Niño adds a third pressure with its own clock. Its effects differ by crop and region, so it is better read as added risk to 2026/27 harvests than as a uniform price push.
| Measure | Figure | Source |
| Probability of El Niño conditions, June-August 2026 | 80% | WMO, as reported June 2026 |
| Australia’s forecast | Strong to very strong event; about half of models peak among the highest since 1950 | Bureau of Meteorology |
| 2026 world rice output | 552.5 million tonnes, 2.4% below the 2025/26 record; reduced and poorly distributed monsoon rains tighten irrigation water | FAO, 2 Oct |
| 2026 world wheat output | 813.9 million tonnes, 3.3% lower | FAO, 2 Oct |
| 2026 coarse grain output | 1,612 million tonnes, 1.3% lower; hot, dry weather cut maize yield prospects | FAO, 2 Oct |
| FAO Sugar Price Index | 114.0, +14.7% on a year; highest since April 2025 | FAO, 2 Oct |
Mixed price effects. The EU’s Joint Research Centre expects global soybean and hard red winter wheat prices to fall in its El Niño scenarios, with maize possibly rising slightly. Its INFORM Warning analysis flags high humanitarian risk over the next six months in a group of African countries that already face conflict, displacement and severe food insecurity, where El Niño would amplify existing vulnerability.
Timing matters. Crops planted this season with too little fertilizer will show it at the 2026/27 harvest, and drought or flood in the same season would compound it. A one-season shortfall can recover if inputs normalize; the lasting risk is a second season of under-application.
How it could accelerate
The pressures run on different clocks, so their effects stack rather than arrive together. Prices and aid cuts are visible now; the yield effect of costly fertilizer and the weather effect of El Niño reach consumers later.
| Channel | How it feeds through | Clock | Latest evidence | What would make it worse |
| Grain freight | Fewer cargoes, higher freight and insurance, importers switch to costlier origins | Now | Cereal index +17.2% on a year; trade forecast cut to 505.8 Mt | Longer closure of Black Sea ports and terminals |
| Fertilizer | Farmers apply less or switch crops; lower yields at coming harvests | Next one to two seasons | Urea above $850/t in April; affordability weakest since mid-2022 | Disruption at Hormuz continuing beyond Q3 2026 |
| Export restrictions | Exporters protect home markets and remove supply from the world | When prices rise further | About 3.5 Mt less urea in trade would add about $134/t | One exporter’s restriction prompting others to follow |
| Weather | Drought and heat in parts of Asia, floods elsewhere | Late 2026 into 2027 | Rice, wheat and coarse grain output all forecast lower; sugar up 14.7% | Strong to very strong El Niño peak |
| Aid funding | Smaller rations, fewer people reached | Now | WFP expects about half of the $13 bn needed; aid covers under half of total needs | Further cuts while needs rise |
| Energy and transport | Fuel and freight costs raise every food price along the chain | Now to 2027 | FAO links Hormuz uncertainty to fuel, fertilizer and freight costs | Persistent high oil and gas prices |
Two cautions keep the picture honest. First, stocks are ample and the price index remains below its 2022 peak, so this is a risk of acceleration, not an acceleration already under way. Second, the World Bank and IFPRI both expect fertilizer prices to ease in 2027 if exports recover, so duration is the decisive variable.
The feedback loop is the danger. Prices rise, importers seek cover, exporters restrict to protect home supply, and prices rise again. IFPRI notes that restrictive action by one country can precipitate similar action by others, as happened in 2007-08, 2020-21 and 2022.
Tripwires to watch
- FAO Food Price Index releases on 6 November and 4 December 2026.
- Fertilizer prices and affordability ahead of the next planting seasons.
- Any new quotas or bans on grain, rice or fertilizer exports.
- Black Sea port operations, freight rates and war-risk insurance.
- Transits through the Strait of Hormuz and Suez Canal.
- Monsoon and Southeast Asian rainfall, and the strength of the El Niño peak.
- WFP funding levels against the $13 billion plan, and any new ration cuts.
What would ease the pressure
The institutions tracking the crisis point to a short list of measures, all aimed at keeping food and inputs moving and protecting the most exposed households.
- Keep trade open. The World Bank recommends temporary easing of trade frictions in fertilizer markets. IFPRI’s modelling shows that rolling back existing export restrictions on urea would return about 6.1 million tonnes to the market and take urea below pre-crisis prices by early 2027.
- Widen supply routes. The World Bank notes Middle East fertilizer flows are already being rerouted through land corridors, and recommends diversifying supply chains for fertilizer feedstocks. FAO notes that alternative grain routes exist but lack the capacity to replace lost sea volumes.
- Support the smallest farmers. The World Bank points to targeted subsidies or cash support for smallholders so that fertilizer use does not collapse as prices rise.
- Act early. FAO and WFP say early action saves lives and is considerably more cost-effective than responding after a crisis has escalated.
- Fund the response. WFP puts 2026 needs at $13 billion and expects about half; its priority list covers about 110 million of the 318 million people facing severe hunger.
- Protect household access. FAO’s Director-General told the launch of the 2026 hunger report that strong economic policies, social protection and sustained investment in agrifood systems can “bend the hunger curve”.
Sources and notes
Notes. Figures are as published by each source and are current to 11 October 2026 unless dated. This report describes disruptions and their effects and does not assign responsibility for any conflict. Estimates of Black Sea export capacity out of service differ by source and date and are shown as a range. WFP’s 318 million and $13 billion figures date from November 2025. The GRFC and SOFI measure different things: acute need in crisis countries and chronic hunger worldwide.
Prices and grain supply
- FAO Food Price Index, 2 October 2026
- FAO Cereal Supply and Demand Brief, 2 October 2026
- FAO chief economist’s statement on Hormuz and the Black Sea (Bernama-Xinhua)
Black Sea
- BIMCO, grain shipments fall 8% as Black Sea attacks escalate
- S&P Global, ship attacks stall wheat trade, 20 August
- Reuters via Marine Insight, farm union on lost port capacity
- Maritime Professional, export capacity shut, 19 August
- Marine Link, Black Sea attacks and Red Sea embargo, 5 August
Fertilizer, energy and freight
- World Bank, fertilizer prices surge as Hormuz disruptions tighten supplies, 14 May 2026
- World Bank, fertilizer rather than food is the bigger yield threat
- IFPRI, how fertilizer policies could exacerbate Hormuz price shocks, 22 May 2026
- IFPRI-AMIS seminar note on Hormuz share of fertilizer flows
- Vessel crossings of Hormuz, Lloyd’s List Intelligence via AgroLatam
- S&P Global, WFP on a dual chokepoint, March 2026
- BIMCO on Suez Canal transits, January 2026
Hunger and aid
- SOFI 2026 summary (IISD) and SOFI 2026 record (EU Knowledge4Policy)
- Global Report on Food Crises 2026, with ten-year findings and data-coverage caution
- FAO-WFP Hunger Hotspots, June-November 2026
- WFP 2026 funding outlook (AFP via Arab News)
Weather
- EU Joint Research Centre on El Niño and humanitarian risk, 15 June 2026
- WMO probability of El Niño (Trustnet)
- Australia’s Bureau of Meteorology warning (Arise
/// nCa, 13 October 2026