В Пномпене состоялось знаковое событие в истории двусторонних отношений Туркменистана и Королевства Камбоджа: 8–9 мая прошли первые в истории межмидовские политические консультации.
Политический диалог
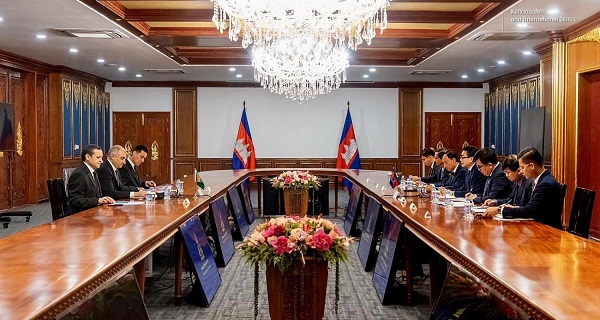
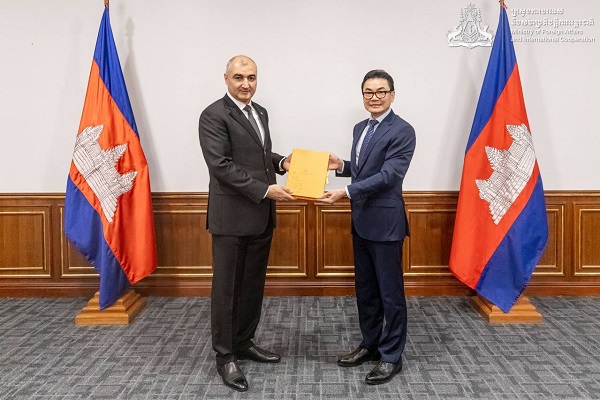
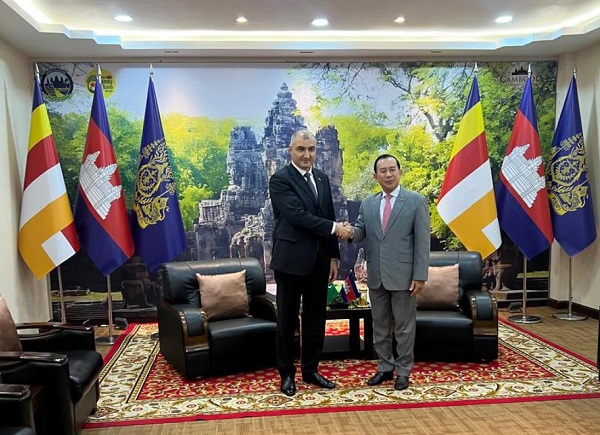
В ходе политических консультаций, где туркменскую делегацию возглавил заместитель министра иностранных дел Ахмет Гурбанов, а камбоджийскую – государственный секретарь МИД Камбоджи Унг Рачана, стороны подчеркнули важность организации контактов на высшем уровне.
Ключевым аспектом переговоров стало взаимодействие в рамках международных организаций. Туркменская сторона выразила признательность Пномпеню за соавторство и поддержку инициатив Туркменистана в ООН. Особое внимание было уделено сотрудничеству по линии АСЕАН: Камбоджа официально поддержала инициативу Ашхабада по созданию формата диалога «Центральная Азия + АСЕАН», который обещает стать эффективной платформой для межрегиональной интеграции.
Диалог был продолжен в ходе встречи с Постоянным государственным секретарем, действующим министром иностранных дел и международного сотрудничества Камбоджи Ит Софеа. Стороны с констатировали высокий уровень организации первых политических консультаций между внешнеполитическими ведомствами. Было подчеркнуто, что данные консультации являются логическим продолжением ранее достигнутых договоренностей и призваны придать импульс диверсификации межгосударственных связей.
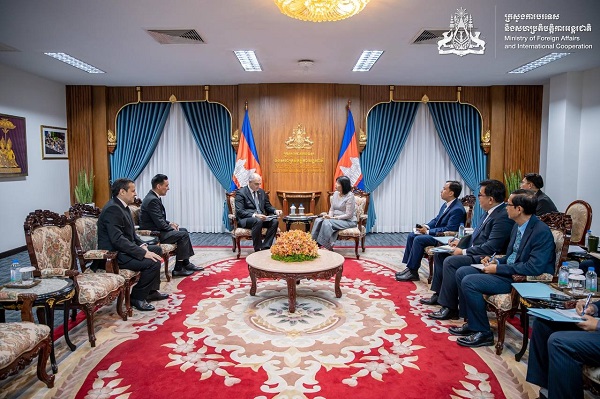
Стороны высказались за активизацию регулярного политического диалога, укреплению контактов на правительственном и парламентском уровнях, на полях международных организаций, прежде всего ООН, через взаимную поддержку инициатив, направленных на обеспечение глобального мира и устойчивого развития.
Экономика: текстиль, логистика и прямые бизнес-контакты
На встрече с президентом Торгово-промышленной палаты Камбоджи Кит Менгом обсуждались конкретные шаги по активизации торгово-экономических связей. Стороны обозначили приоритетные векторы, в ичсле которых – развитие цифровой торговли, регулярный обмен делегациями предпринимателей и участие в международных выставках, организация презентаций экспортного потенциала двух стран, взаимодействие в сфере малого и среднего бизнеса и установление связей между свободными экономическими зонами и промышленными кластерами.
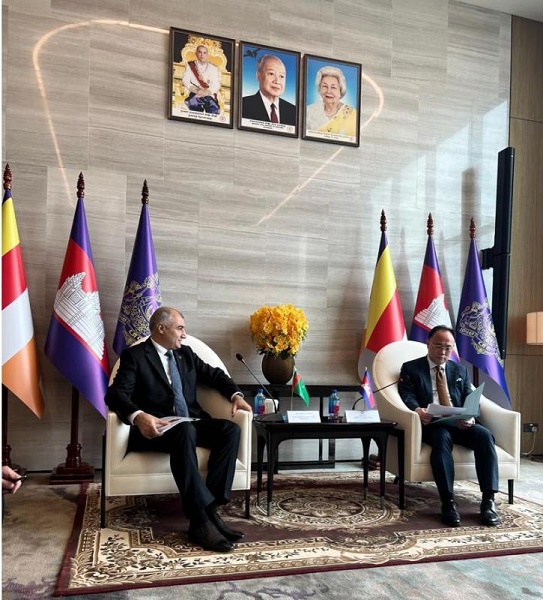
Туризм и культура: на пути к Меморандуму
Гуманитарный вектор стал центральной темой беседы с министром туризма Камбоджи Хуот Хаком. Признавая туризм важным инструментом сближения народов, стороны договорились о разработке и подписании Меморандума о взаимопонимании в области туризма. ///nCa, 9 мая 2026 г.