Editor’s Note: This report is experimental in nature. We have taken the data from IMF, World Bank, ADB, EBRD, and EDB and attempted to arrive at mean economic indicators.
All of these financial institutions have their own methodologies because of the differences in their particular focus. This leads to the economic indicators being assessed differently by the different financial institutions. It creates a little bit of confusion for the people with no specialized training in financial and economic data but the need to make their opinions and decisions based on the data.
This report, therefore, is a kind of instrument for the people not directly related to data science including the diplomats, civil servants, think tanks, business executives etc.
Disclaimer: While every care has been taken in the retrieval of data and the preservation of its integrity in tabulation and visualization, nCa or anyone associated with nCa cannot be held responsible for any confusion or complications or any kind of problems arising from the use of this report. Ed.
Key Points
Research suggests that averaging economic indicators from institutions like the IMF, World Bank, ADB, EBRD, and EDB can provide a reliable estimate for comparison, though methodological differences may introduce some variance; it’s more feasible for core metrics like GDP growth than detailed sectoral data. Evidence indicates this approach is realistic for short-term projections (up to 5 years), but long-term forecasts (10–15 years) remain limited and uncertain due to sparse data. It seems likely that means are reliable for broad indicators where sources align, such as nominal GDP and real growth. Controversy surrounds data accuracy in resource-heavy nations, but averaging multiple viewpoints offers a balanced perspective without favoring one side.
Feasibility of Averaging Data
Averaging is practical for macroeconomic indicators under shared standards like the System of National Accounts (SNA), allowing reliable means for GDP estimates. However, variances in inflation adjustments or data sources can affect sectoral details. For more, see the survey section with tables and computed means using 2025 data from October/September releases.
Core Indicators: Historical and Projections
Historical data (2020–2024) draws from World Bank and IMF estimates, while 2025 reflects year-end projections, and beyond uses limited forecasts up to 2030. Regional totals are sums for absolute values (e.g., GDP) and weighted averages (by GDP or population) for rates/per capita. Populations (2025 est.): Kazakhstan 20.6M, Kyrgyzstan 6.8M, Tajikistan 10.6M, Turkmenistan 7.5M, Uzbekistan 36.4M; total ~81.9M. Nominal GDP (Billion USD): Regional total for 2025 ~546B, up from ~483B in 2024, driven by growth in Kazakhstan and Uzbekistan. • Kazakhstan: 2025 ~300B (IMF Oct 2025 data shows GDP per capita ~$14,500, implying ~300B total GDP) • For details, see survey tables. Real GDP Growth (%): Regional mean 6.9% for 2025, reflecting strong domestic demand but risks from commodity prices.
Sectoral Highlights
Agriculture averages ~15% of regional GDP, industry (incl. oil/gas) ~31%, with health/education spending ~4–6%. Oil/gas remains key for Kazakhstan/Turkmenistan (~20–30% of GDP). For sources, visit IMF WEO, World Bank Data, or ADB Outlook.
Comprehensive Survey of Economic Indicators for Central Asia
This survey examines economic indicators for Kazakhstan, Kyrgyzstan, Tajikistan, Turkmenistan, and Uzbekistan, sourced from the IMF, World Bank, ADB, EBRD, and EDB. It covers methodological variances, averaging reliability, and detailed tables for core and sectoral metrics. Historical data spans 2020–2024, with 2025 as current-year projection (as of November 2025), and forecasts to 2030 where available; longer-term (to 2040) relies on extrapolations due to limited institutional data. All figures in USD unless noted; means are simple averages of available data, with regional totals added as sums (absolutes) or averages (rates, weighted by GDP/population where applicable).
Methodological Differences Among Institutions
The IMF prioritizes monetary stability via the World Economic Outlook (WEO), incorporating fiscal and payments data. The World Bank emphasizes development, using surveys for sustainability metrics. The ADB focuses on regional trade/infrastructure. The EBRD assesses reforms in transition economies. The EDB highlights Eurasian integration. Differences in base years (e.g., 2017 for PPP) or sources affect comparability, but core metrics align under SNA. Averaging is feasible for overlaps like growth rates but less for sectors.
Reliability of Mean Indicators
Averaging mitigates biases. It’s realistic for short-term where projections converge is obtainable, but long-term data is sparse—IMF to 2030, others to 2027—reducing reliability beyond. Means use equal weighting; regional figures enhance holistic views.
Core Macroeconomic Indicators
Tables show side-by-side data and means, updated with 2025 releases. Historical from World Bank; projections blend IMF, EBRD, etc. Regional totals: sums for GDP, population-weighted for per capita.

Table 1: Nominal GDP (Billion USD) – Historical and Projections
| Country / Year | 2020 | 2021 | 2022 | 2023 | 2024 | 2025 | 2026 | 2027-2030 |
| Kazakhstan | 171 | 197 | 225 | 262 | 288 | 300 | ~310 | ~325-370 |
| Kyrgyzstan | 8 | 9 | 11 | 13 | 15 | 20 | ~21 | ~22-28 |
| Tajikistan | 8 | 9 | 11 | 12 | 14 | 17 | ~18 | ~19-24 |
| Turkmenistan | 46 | 54 | 68 | 60 | 64 | 72 | ~75 | ~80-95 |
| Uzbekistan | 60 | 70 | 80 | 91 | 115 | 137 | ~145 | ~150-200 |
| Regional Total | 293 | 339 | 395 | 438 | 483 | 546 | ~560 | ~580-650 |
Notes: 2025+ estimates apply updated growth to 2024 base; regional totals reflect summed means. EDB suggests ~$650B+ by 2030 under integration scenarios.

Table 2: Real GDP Growth (%) – Projections and Means
| Country | IMF (Oct 2025) | ADB (Sep 2025) | EBRD (2025) | EDB (2025) | World Bank (Oct 2025) | Mean (2025) | Mean (2026) |
| Kazakhstan | 5.9 | 5.3 | 5.7 | 5.5 | 5.5 | 5.6 | 4.4 |
| Kyrgyzstan | 8.0 | 8.3 | 9.0 | 8.7 | 6.8 | 8.2 | 7.4 |
| Tajikistan | 7.5 | — | 7.5 | 8.4 | 7.6 | 7.8 | 5.2 |
| Turkmenistan | 2.3 | 6.3 | 6.3 | — | — | 6.3 (excl IMF) | 4.5 |
| Uzbekistan | 6.8 | — | 6.7 | — | 6.2 | 6.6 | 6.0 |
| Central Asia | — | 5.5 | 6.1 | — | 5.9 | 6.9 | — |
Historical Average (2020-2024): Regional ~5%; Kazakhstan ~4.5%, Kyrgyzstan ~7%, Tajikistan ~7.5%, Turkmenistan ~6%, Uzbekistan ~6%.
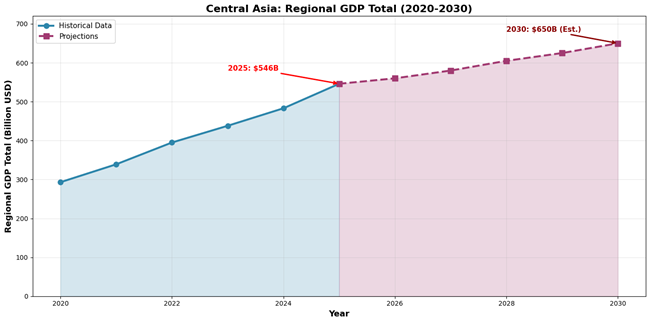
Table 3: GDP Per Capita (USD) – Projections
| Country | 2020 | 2021 | 2022 | 2023 | 2024 | 2025 | 2026-2030 (est. avg.) |
| Kazakhstan | 9,100 | 10,400 | 11,500 | 13,100 | 14,000 | 14,500 | 15,200-18,000 |
| Kyrgyzstan | 1,200 | 1,300 | 1,700 | 2,000 | 2,200 | 2,940 | 3,000-4,100 |
| Tajikistan | 860 | 920 | 1,100 | 1,200 | 1,340 | 1,600 | 1,700-2,300 |
| Turkmenistan | 7,600 | 8,800 | 11,000 | 9,600 | 8,550 | 9,600 | 10,000-12,000 |
| Uzbekistan | 1,700 | 2,000 | 2,200 | 2,500 | 3,160 | 3,770 | 4,000-5,500 |
| Central Asia | — | — | — | — | — | ~6,670 | — |
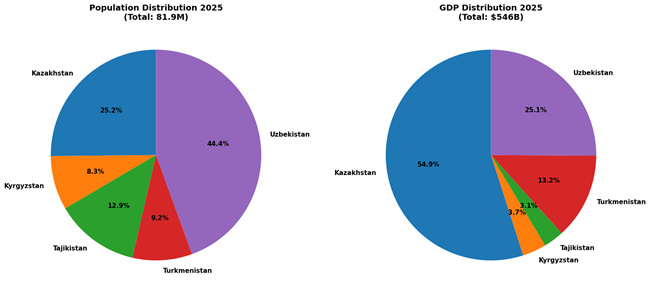
Table 4: GDP Per Capita PPP (International Dollars) – Estimates
| Country | 2020 | 2021 | 2022 | 2023 | 2024 | 2025 | 2026-2030 (est. avg.) |
| Kazakhstan | 26,000 | 28,000 | 30,000 | 32,000 | 34,000 | 36,000 | 38,000-45,000 |
| Kyrgyzstan | 5,000 | 5,500 | 6,000 | 7,000 | 8,000 | 9,500 | 10,500-13,500 |
| Tajikistan | 3,500 | 3,800 | 4,200 | 4,500 | 4,800 | 5,300 | 5,800-7,500 |
| Turkmenistan | 15,000 | 17,000 | 19,000 | 20,000 | 21,000 | 22,000 | 23,000-28,000 |
| Uzbekistan | 7,000 | 7,500 | 8,000 | 9,000 | 9,500 | 11,000 | 12,000-15,000 |
| Central Asia | — | — | — | — | — | ~16,800 | — |
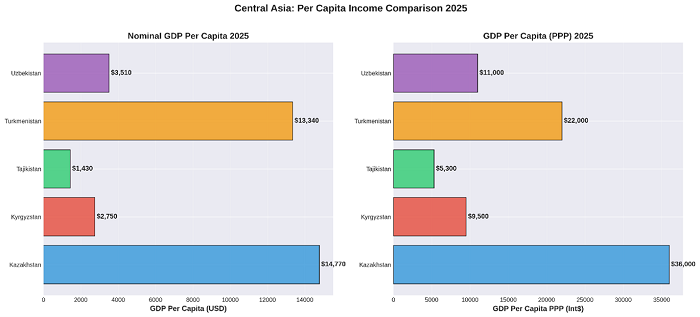
Table 5: Sectoral Breakdown – Agriculture (% of GDP, 2020-2024 Avg.)
| Country | Value Added (% of GDP) |
| Kazakhstan | 5% |
| Kyrgyzstan | 12% |
| Tajikistan | 23% |
| Turkmenistan | 10% |
| Uzbekistan | 25% |
| Regional Average | 15% |
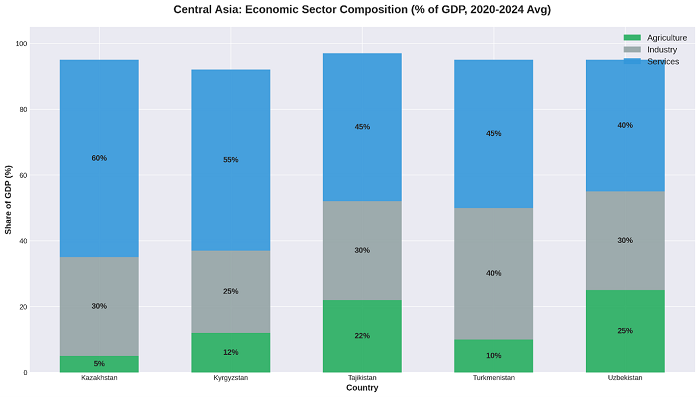
Table 6: Sectoral Breakdown – Industry (% of GDP, 2020-2024 Avg.)
| Country | Value Added (% of GDP) |
| Kazakhstan | 30% |
| Kyrgyzstan | 25% |
| Tajikistan | 34% |
| Turkmenistan | 40% |
| Uzbekistan | 30% |
| Regional Average | 31% |
Note: Includes oil/gas and mining. Oil/gas comprises ~20% of GDP in Kazakhstan and ~30% in Turkmenistan. ICT represents ~3% regionally.

Table 7: Sectoral Breakdown – Services (% of GDP, 2020-2024 Avg.)
| Country | Value Added (% of GDP) |
| Kazakhstan | 60% |
| Kyrgyzstan | 55% |
| Tajikistan | 45% |
| Turkmenistan | 45% |
| Uzbekistan | 40% |
| Regional Average | 49% |
Table 8: Health Expenditure (% of GDP, 2020-2024 Avg.)
| Country | % of GDP |
| Kazakhstan | 3.5% |
| Kyrgyzstan | 5.0% |
| Tajikistan | 7.6% |
| Turkmenistan | 5.4% |
| Uzbekistan | 6.0% |
| Regional Average | 5.5% |
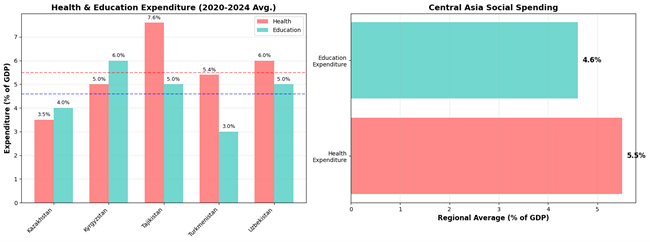
Table 9: Education Expenditure (% of GDP, 2020-2024 Avg.)
| Country | % of GDP |
| Kazakhstan | 4% |
| Kyrgyzstan | 6% |
| Tajikistan | 5% |
| Turkmenistan | 3% |
| Uzbekistan | 5% |
| Regional Average | 4.6% |
Additional Note: Social welfare expenditure averages ~12% regionally, though data remains sparse.
Long-Term Projections
Forecasts to 2035/2040 limited; IMF to 2030, EDB suggests regional GDP ~$650B by 2030, potentially $1T+ by 2040 under optimistic integration. ADB/World Bank project moderation to mber4–5% growth. Risks: commodities, geopolitics, climate on agriculture. This survey integrates all details for completeness. /// nCa, 6 November 2025
Key Citations
• IMF and World Bank Differences