nCa Report
Overall Growth in the LNG Market
The global liquefied natural gas (LNG) market expanded significantly in 2025, with trade volumes reaching an estimated 422.8-429 million tonnes (MT), up 3.9-4% from 2024’s 411 MT.
This growth was driven by new capacity additions, particularly in the U.S., and rebounding demand in regions like Europe and emerging markets. Liquefaction capacity rose to around 494-500 million tonnes per annum (MTPA) by end-2025, with projections for further expansion to 740 MTPA by 2030, a 40% increase.
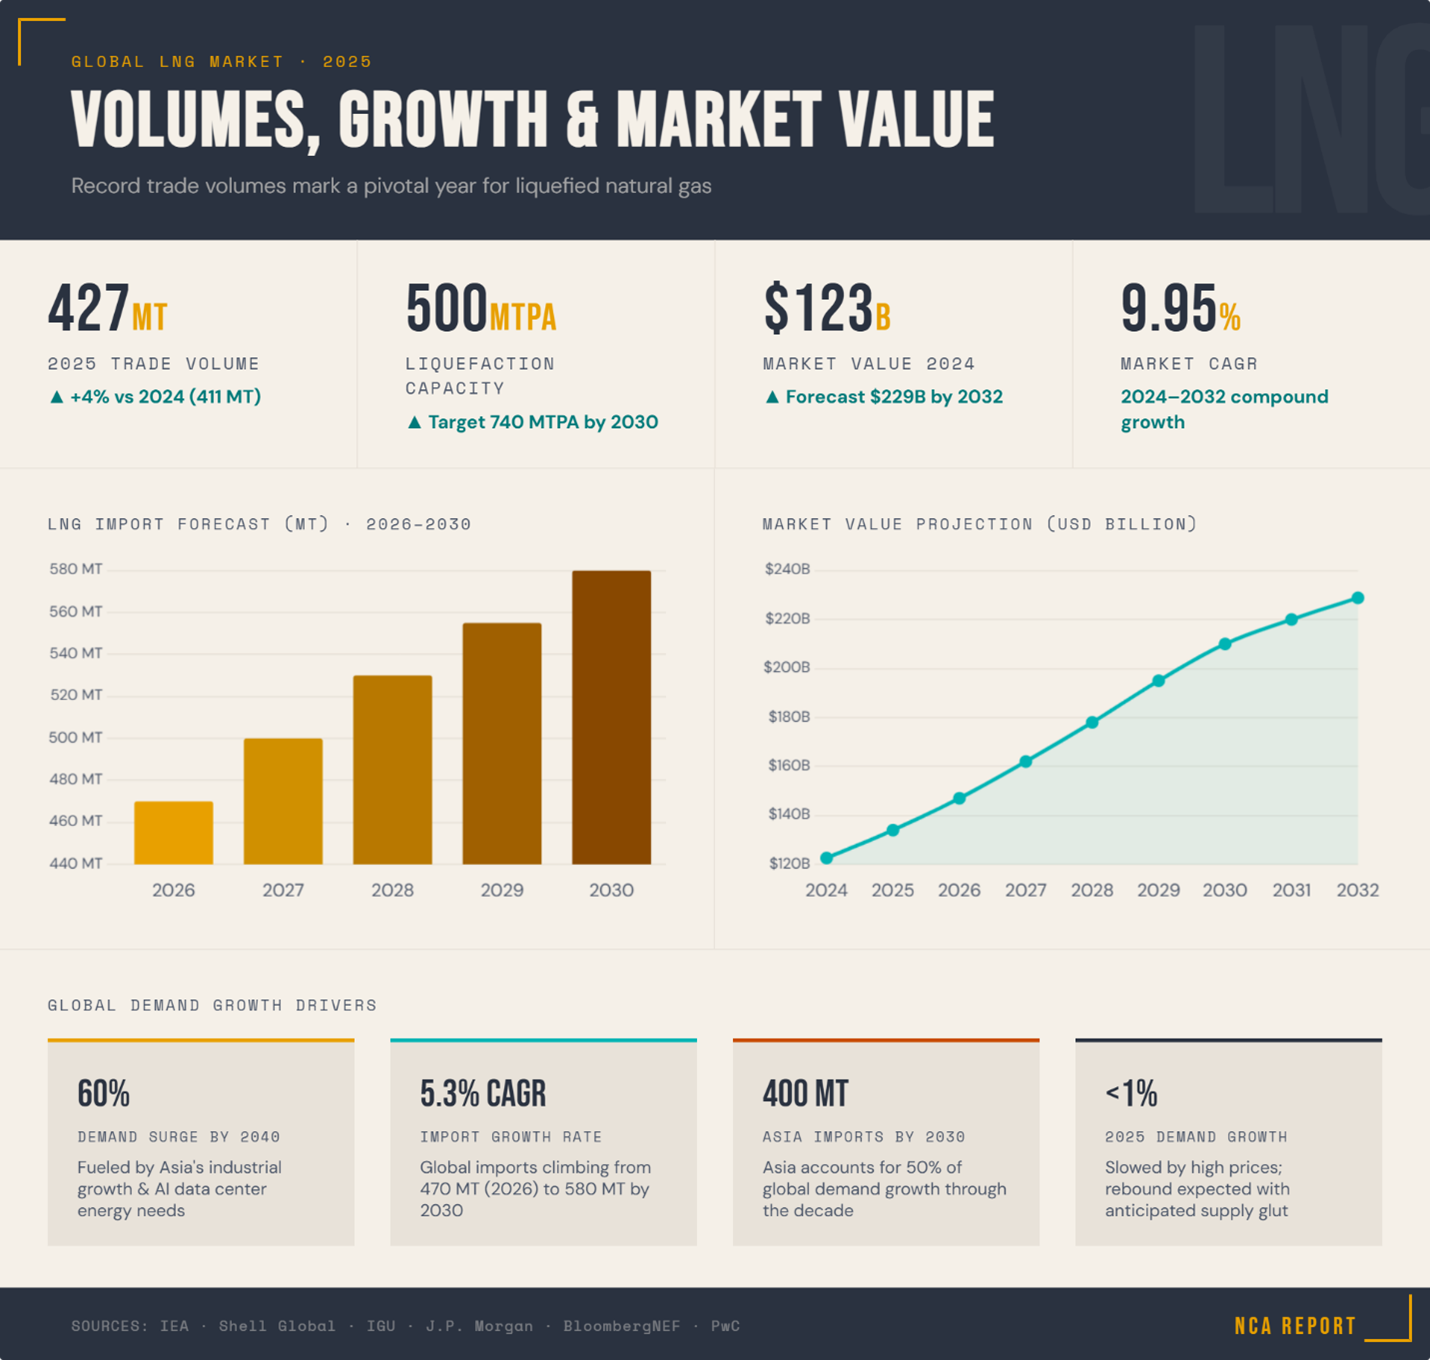
Global LNG imports are forecast to climb from 470 MT in 2026 to 580 MT by 2030, at a compound annual growth rate (CAGR) of 5.3%.
Demand is expected to surge by 60% by 2040, fueled by Asia’s industrial growth, emissions reductions, and rising energy needs from AI and data centers. The market value, valued at USD 122.6 billion in 2024, is projected to reach USD 228.83 billion by 2032, growing at a CAGR of 9.95%.
Main Suppliers and Buyers
Main Suppliers (Exporters)
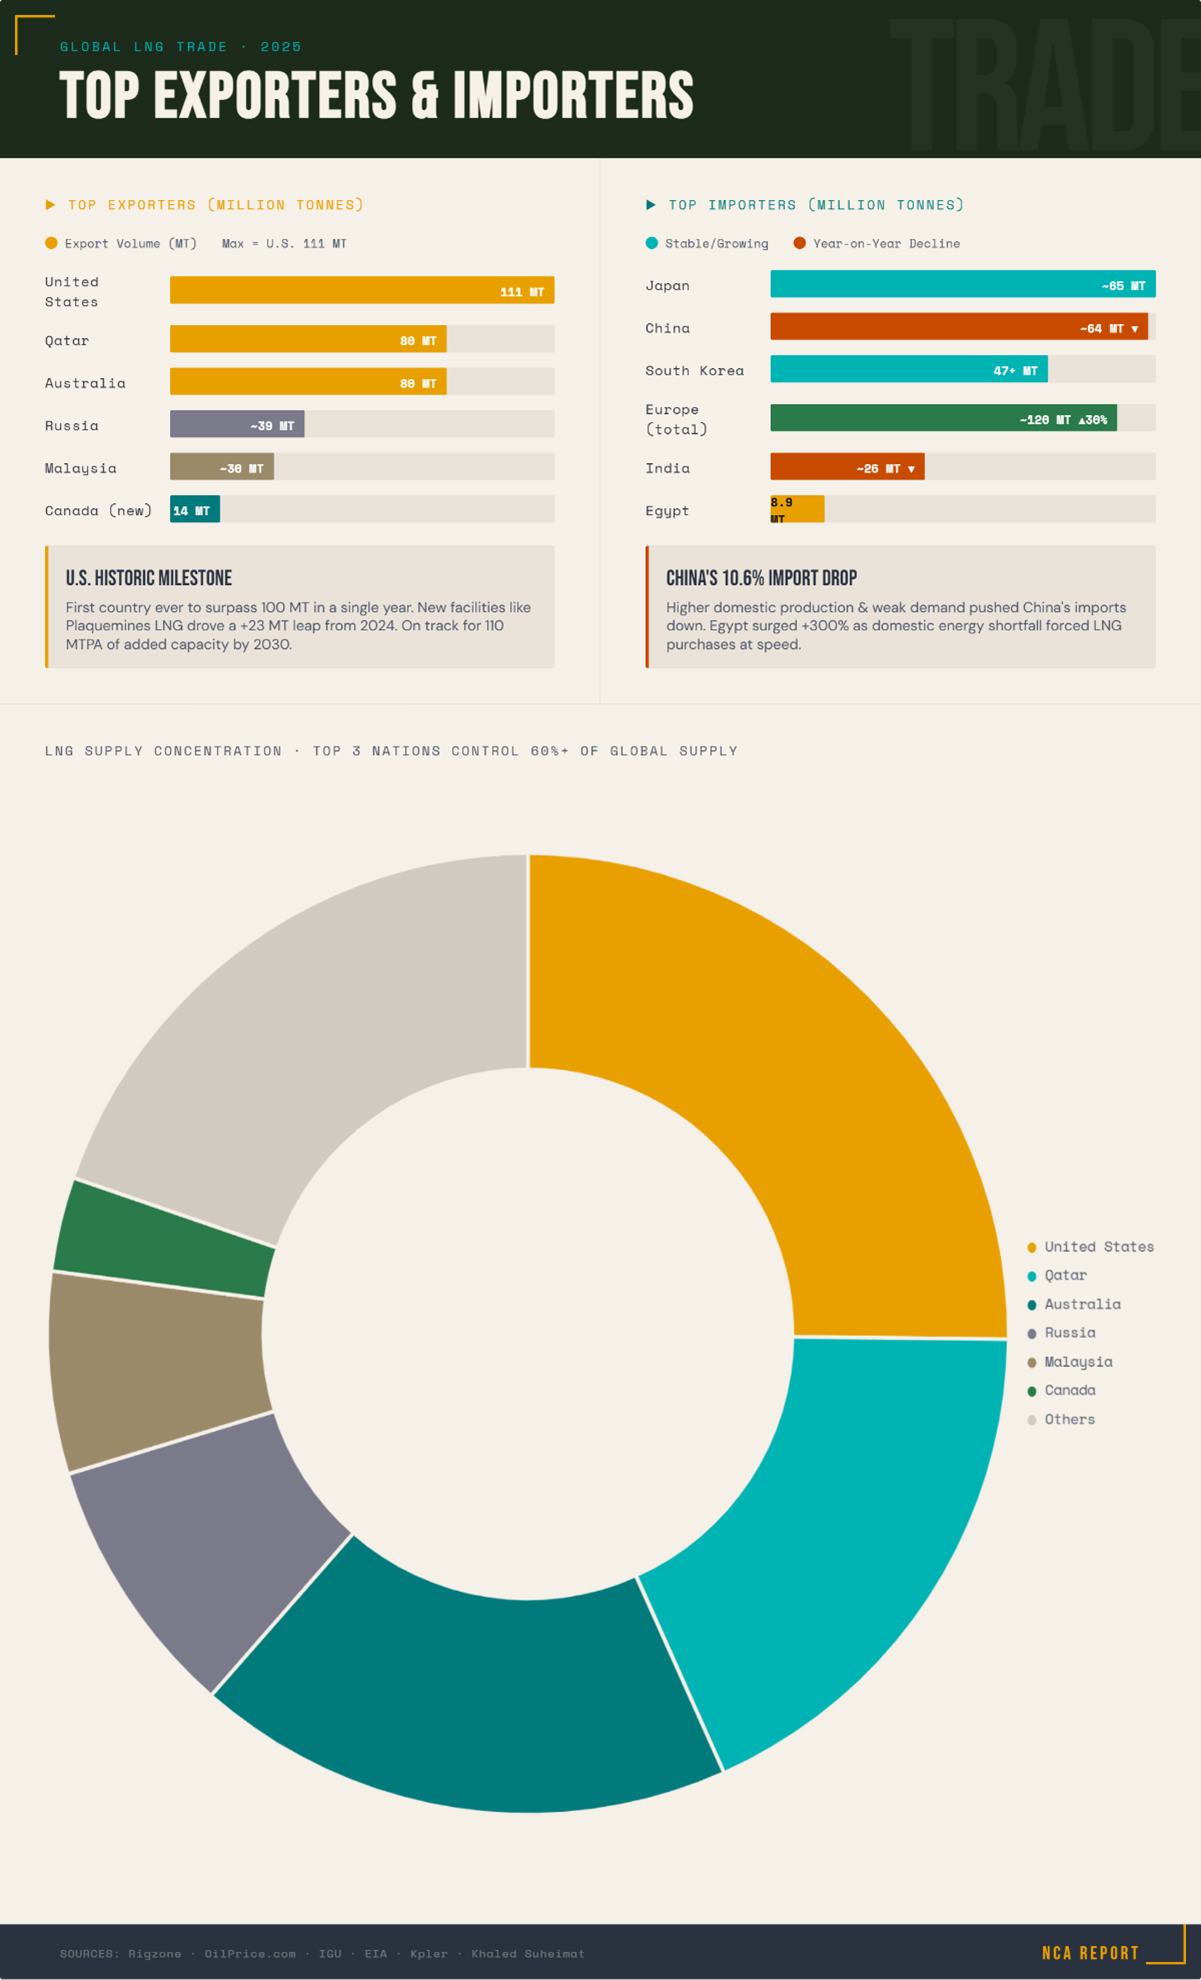
In 2025, the U.S., Qatar, and Australia dominated, accounting for over 60% of global supply.
- United States: Exported a record 111 MT, the first country to surpass 100 MT, up ~23 MT from 2024, driven by new facilities like Plaquemines LNG. Capacity reached 102.3 MTPA by September 2025; set to add ~110 MTPA by 2030.
- Qatar: Exported ~80 MT; expansions aim for 142 MTPA by 2030.
- Australia: ~80 MT.
- Others: Russia, Malaysia; Canada adding 14 MTPA via LNG Canada in 2025.
Main Buyers (Importers)
Asia led imports, but China’s volumes declined; Europe saw a surge.
- Japan: ~65 MT, tied with China as top importer.
- China: ~64-70 MT, down 10.6% from 2024 due to higher domestic production and weak demand.
- South Korea: Over 47 MT.
- India: ~24-27 MT, down slightly.
- Egypt: Surged to ~8.9 MT, up over 300%.Europe’s imports rose 30% to ~120 MT, with U.S. supplying 77.5%. Asia’s imports projected to hit 400 MT by 2030.
Shift from Pipeline Gas to LNG and Reasons
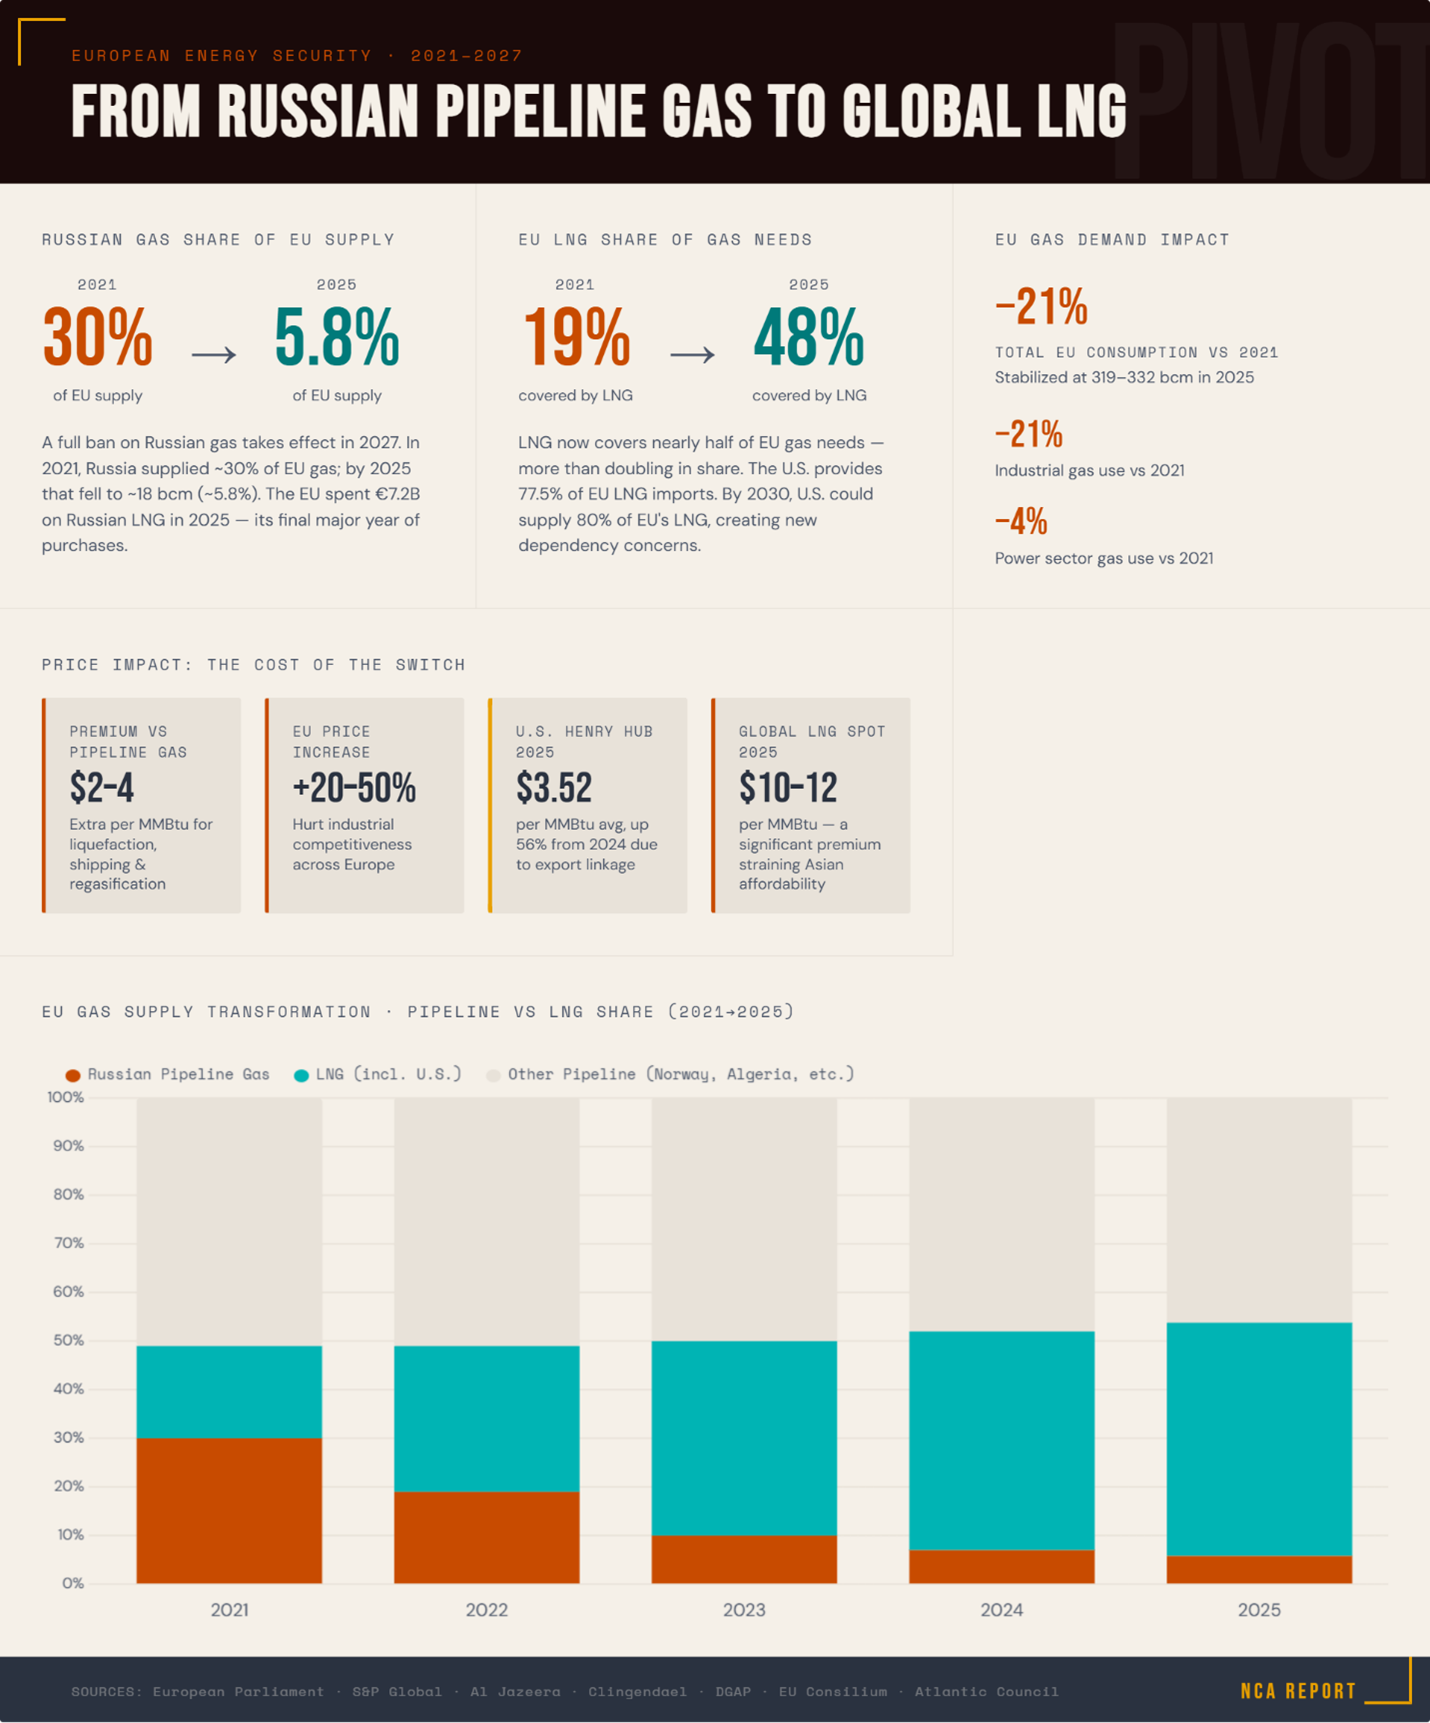
Europe’s reliance on Russian pipeline gas fell to ~5.8% of supply in 2025 (~18 bcm), down from 30% in 2021. LNG now covers 48% of EU gas needs, up from 19% in 2021. A full ban on Russian gas starts in 2027.
Reasons: Geopolitical tensions post-Ukraine invasion prompted diversification for security; EU aims to end Russian imports by 2027. LNG’s flexibility aids long-distance transport where pipelines are impractical. Globally, LNG’s trade share rises due to similar factors in Asia.
Price Impact: Additional Costs to Buyers from the Switch
The switch to LNG adds USD 2-4/MMBtu in costs for liquefaction, shipping, and regasification versus pipeline gas. In Europe, replacing Russian pipeline gas has raised prices 20-50%, hurting industrial competitiveness. U.S. prices rose 56% to $3.52/MMBtu avg in 2025 due to exports linking to global markets. Global LNG spots averaged $10-12/MMBtu in 2025 vs. Henry Hub $3.52/MMBtu. This premium strains affordability in Asia.
Has Demand Been Artificially Curbed Due to the Switch?
Yes, particularly in Europe, where high LNG prices and economic pressures reduced demand. EU consumption stabilized at 319-332 bcm in 2025, down 21% from 2021, with industrial gas use falling 21% and power 4%. China’s imports dropped 10.6% due to costs and domestic supply. Global growth slowed to <1% in 2025 from high prices. Policy-driven shifts raise costs, curbing demand, but rebound expected with supply glut.
Global Gas Market Outlook: Pipeline vs. LNG (2026-2030)
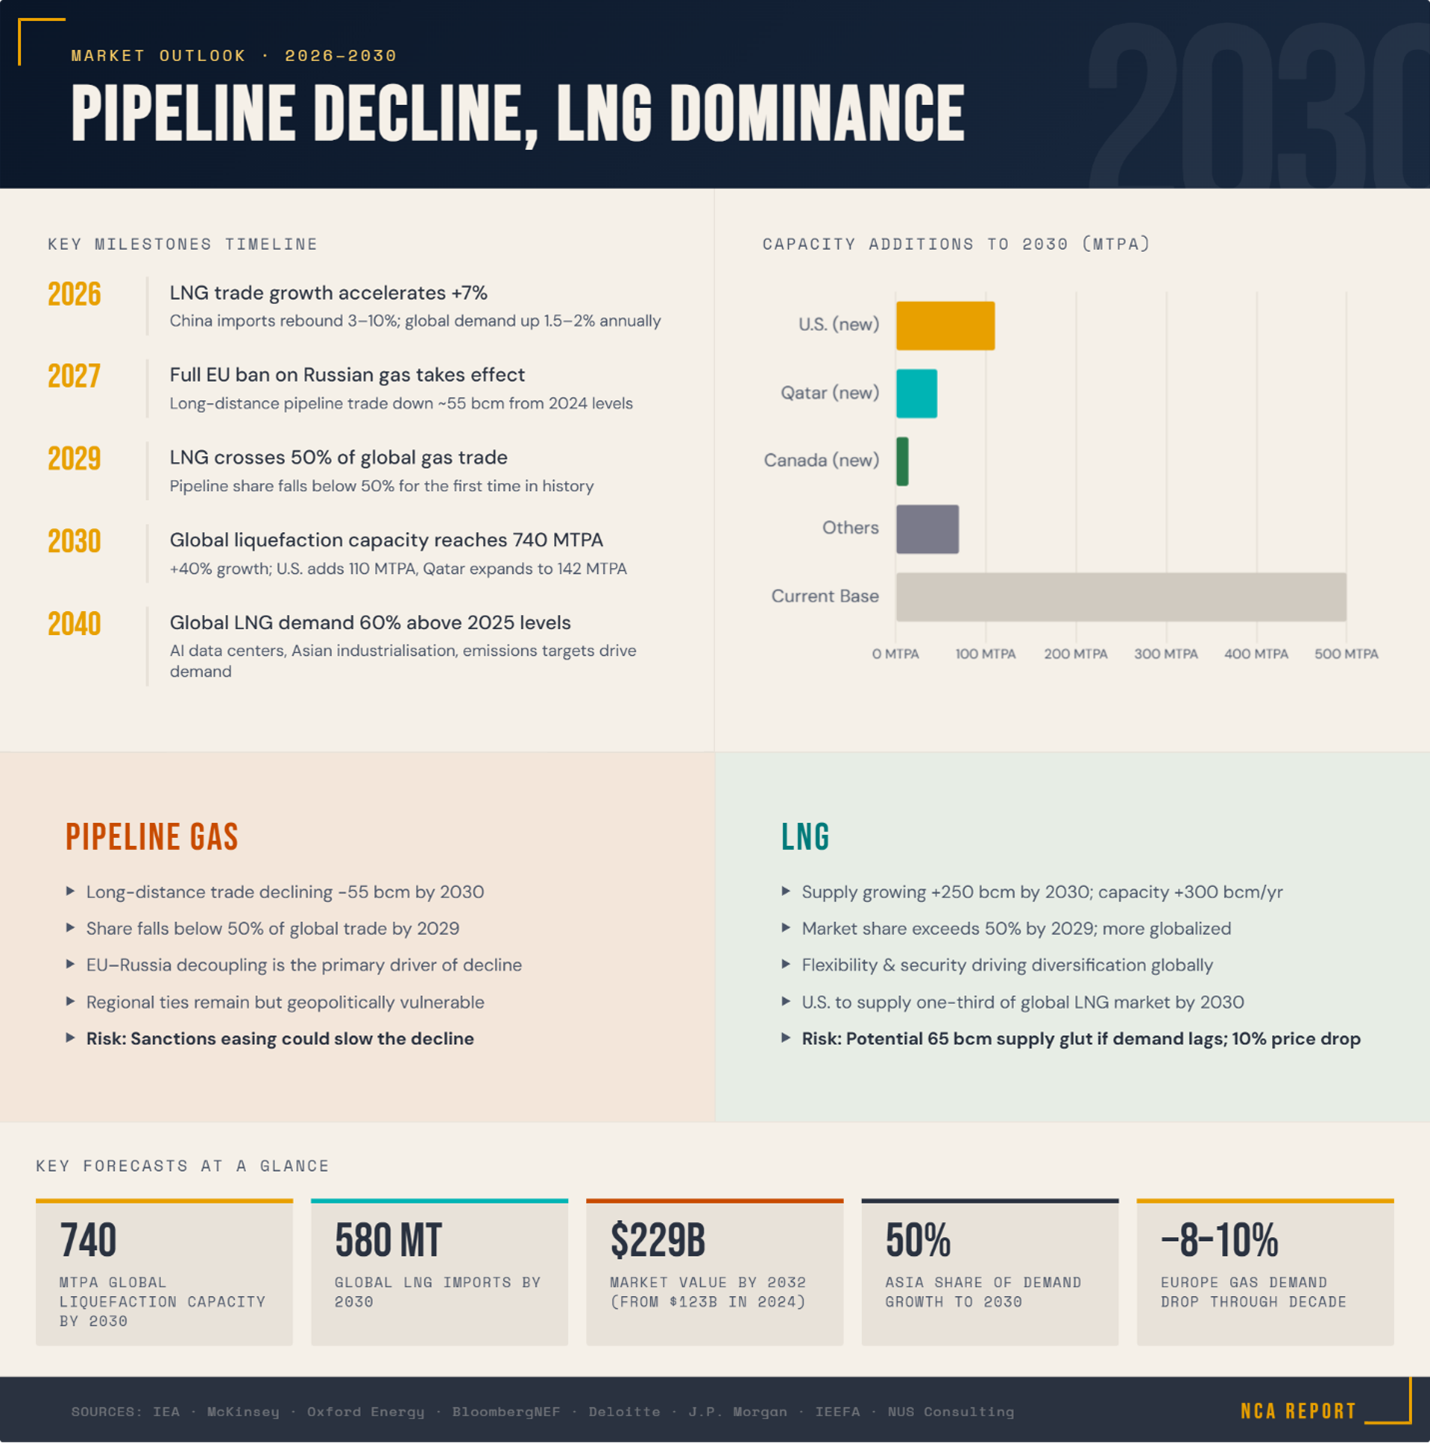
LNG will dominate, with supply growing ~250 bcm by 2030 and trade share >50% by 2029. Long-distance pipeline trade declines ~55 bcm, mainly Europe-Russia decoupling. Global demand rises 1.5-2% annually (~380 bcm growth), led by Asia (50%) and Middle East (30%); Europe drops 8-10%.
| Aspect | Pipeline Gas | LNG |
| Growth Trend | Declining: -55 bcm in long-distance trade by 2030 due to geopolitics (e.g., EU-Russia ban by 2027). | Surging: +250 bcm supply by 2030; capacity +300 bcm/yr, led by U.S. (110 MTPA) and Qatar (46 MTPA). +7% growth in 2026. |
| Market Share | <50% of global trade by 2029. | >50%; more flexible, globalized. |
| Key Drivers | Regional ties; geopolitics vulnerable. | Security, diversification; Asia imports (e.g., China rebound 3-10% in 2026). |
| Risks/Outlook | Surplus regionally; sanctions easing could slow decline. | Potential glut (65 bcm surplus by 2030) if demand lags; prices fall 10% in Europe/Asia. |
Base scenarios assume steady growth; upsides include AI demand or tensions; downsides include renewed Russian flows. /// nCa, 20 February 2026
Sources
- Growth in global demand for natural gas is set to accelerate in 2026 as LNG wave spreads through markets – IEA (Published: Jan 23, 2026) – Details on 2025 LNG supply growth and 2026 projections.
- LNG Outlook 2025 | Shell Global (Published: Oct 31, 2025) – Overview of 2024-2025 trade volumes and demand forecasts to 2040.
- Global gas price paths diverge as LNG reshapes market balances – World Bank Blogs (Published: Dec 9, 2025) – Analysis of 2025 demand slowdown and 2026 rebound, with price divergence.
- Global liquefied natural gas market development and future outlook – Projections for LNG imports to 2030 and capacity growth.
- Annual Review of the Global LNG Market in 2025 and Outlook for 2026 – Record 2025 volumes and 2026 expectations.
- Liquefied natural gas outlook | J.P. Morgan Research (Published: Feb 20, 2025) – Supply capacity growth to 2030.
- 2025 World LNG Report – International Gas Union (IGU) (Published: May 22, 2025) – 2024 trade data and capacity additions.
- Global Gas and LNG Outlook | BloombergNEF – Medium-term forecasts for LNG supply/demand.
- Navigating the future of LNG: Strategy, supply and global demand shift – PwC – Demand and supply growth to 2030.
- Global LNG Outlook 2024-2028 – IEEFA – Supply glut risks and demand projections.
- Liquefied Natural Gas (LNG) Market Size & Share Analysis – Growth Trends and Forecast (2026 – 2031) (Published: Jan 27, 2026) – Market size from 2025 to 2031.
- Global LNG Capacity Tracker – Data Tools – IEA (Published: Feb 5, 2026) – Export capacity additions to 2030.
- Global LNG Winter Outlook 2024-25: Slightly Bullish Start | BloombergNEF (Published: Sep 20, 2024) – Winter 2024-2025 demand forecasts.
- Global Gas Report 2025 Presentation – YouTube – 2024-2025 demand growth data.
- LNG Forecasts Decline: Supply Surges, Demand Softens – Responsible Alpha (Published: Dec 17, 2025) – Capacity and demand to 2030.
- 2025 World LNG Report – International Gas Union (IGU) (Published: May 22, 2025) – Exporters and importers data.
- Natural Gas Imports and Exports Monthly June 2025 – U.S. export details.
- 2025 Saw Biggest Jump in LNG Exports in 3 Years, Kpler Says | Rigzone (Published: Dec 30, 2025) – Global export records.
- Top 10 LNG Exporters in 2025: Global Leaders in Gas Production | Khaled Suheimat – Top producers and consumers.
- U.S. LNG Exports Break 100 Million Tons in Record 2025 | OilPrice.com (Published: Jan 2, 2026) – U.S. export milestones.
- EU to phase out imports of Russian gas | News | European Parliament (Published: Dec 17, 2025) – EU ban on Russian LNG.
- EU Spent €7.2 Billion On Russian LNG in 2025 (Published: Jan 19, 2026) – EU imports before ban.
- EU finalizes ban on Russian gas, LNG by 2027 | S&P Global (Published: Jan 26, 2026) – Ban timelines.
- Europe’s Selective Blindness on Gas – Clingendael Institute (Published: Jan 20, 2026) – Shift to U.S. LNG.
- European Energy Security Amid Blackmail, Dependency, and Dominance | DGAP (Published: Feb 9, 2026) – Post-Russia supply changes.
- Where does the EU’s gas come from? – Consilium – EU supply sources in 2025.
- In 2025, U.S. natural gas spot prices increased from 2024’s record low – EIA (Published: Jan 9, 2026) – Price increases due to exports.
- Natural Gas Market Indicators – October 15, 2025 (Published: Oct 15, 2025) – Henry Hub forecasts.
- U.S. LNG Profits Exposed as Market Again Shifts (Published: Jan 8, 2026) – Price convergence impacts.
- LNG and Data Center Demand, International Wildcards Top 2025 Demand Drivers – Price drivers from LNG.
- Why U.S. Natural Gas Prices Could Be Headed Higher In 2026 – Forbes (Published: Nov 7, 2025) – Price rises from exports.
- Feature Article: Gas prices expected to experience moderate fluctuations – 2025-2026 price outlook.
- Natural Gas Prices Expected to Rise Amid Increasing LNG Exports (Published: Aug 21, 2025) – Export-driven prices.
- Executive summary – Gas Market Report, Q3-2025 – Analysis – IEA – Supply and price trends.
- 2025 LNG Buyers’ Survey: Strategy in a changing energy market – McKinsey (Published: Feb 2, 2026) – Buyer strategies and prices.
- US LNG export dominance to be tested as sellers look beyond Europe | Reuters (Published: Nov 21, 2025) – Export shifts.
- Global LNG export capacity by country 2025 – Statista – Capacity rankings.
- About one-fifth of global liquefied natural gas trade flows through the Strait of Hormuz – EIA (Published: Jun 24, 2025) – Trade routes.
- List of countries by natural gas exports – Wikipedia – Export rankings.
- Trading LNG Import & Export | World LNG balance – Enerdata – Trade balances.
- In 2025, the U.S. became the first country to export more than 100 mmt of LNG – U.S. milestone.
- The End of Russian Gas Transit via Ukraine – Oxford Institute for Energy Studies – Ukraine transit end.
- Europe finally moves to ban Russian gas but potential loopholes remain – Atlantic Council (Published: Oct 31, 2025) – EU ban details.
- How Europe Replaced Russian Pipeline Gas: The Full Story – YouTube – Replacement strategies.
- From draft regulation to outright sanction – Russian LNG moving out from the European Union (Published: Oct 20, 2025) – LNG exemptions.
- ‘Closing the tap’: EU agrees on deal to end Russian gas imports by 2027 – Al Jazeera (Published: Dec 3, 2025) – Agreement details.
- The EU Strategy for the Gradual Phase-Out of Russian Natural Gas – Phase-out framework.
- Europe’s LNG buildout slows amid anticipated decline in gas demand | IEEFA (Published: Oct 30, 2025) – Infrastructure slowdown.
- Natural Gas supply to Europe – Reddit – Supply maps.
- EU risks new energy dependence as US could supply 80% of its LNG imports by 2030 (Published: Jan 19, 2026) – U.S. dependency.
- Global Gas Outlook to 2050 – McKinsey – Long-term pipeline vs. LNG.
- The Global Outlook for Gas Demand in a $6 World – Oxford Institute for Energy Studies (Published: Oct 1, 2025) – Demand at lower prices.
- Global LNG Market Faces Looming Supply Glut – EnergyNow.com (Published: Sep 2025) – Supply surplus to 2030.
- US Natural Gas Market Analysis & LNG Outlook | Deloitte Global – U.S. role to 2030.
- U.S. LNG to Supply One-third of Global Market by 2030 (Published: Oct 28, 2025) – U.S. market share.
- Global LNG Market Forecast 2030: Supply, Demand & Trends – NUS Consulting Group (Published: Nov 20, 2025) – Forecasts to 2030.
- Global LNG Outlook 2024-2028 – Energy.gov – Supply and demand to 2028.
- Bits and Pieces, Encore Edition – LNG Exports, Data Centers – North American growth.
- TC Plots Pipeline Capacity for Years-Long Growth in Gas Demand – Pipeline expansions to 2030.
- Global Gas Tightness Eases as LNG Growth Surges, Pipeline Flows Decline (Published: Nov 20, 2025) – LNG vs. pipeline dynamics.