
nCa-AI Collaborative Report
Landlocked oil-producing countries encounter significant hurdles when competing with their coastal counterparts, primarily due to elevated transportation expenses and reliance on neighboring nations for export routes.
Research suggests these nations often sell their crude at a discount to remain competitive, with the reduction typically reflecting added logistics costs and market dynamics. While global frameworks like international transit agreements aim to level the playing field, landlocked producers hold a modest 3-4% share of worldwide oil output, a figure that appears to have remained relatively steady or edged slightly downward amid rising production from non-landlocked giants.
The core challenge for landlocked oil producers stems from their geographic isolation from seaports, forcing them to depend on pipelines, railways, or roads through transit countries to reach international markets.
This not only inflates costs—sometimes by 50% or more compared to global averages—but also introduces delays, border inefficiencies, and geopolitical vulnerabilities.
For instance, issues like bribe demands, trucking cartels, or political tensions in transit nations can disrupt flows and erode competitiveness against countries with direct ocean access, where shipping is simpler and cheaper.
Evidence indicates that landlocked producers frequently offer discounts to align their effective prices with those of coastal rivals, ensuring buyers aren’t deterred by the extra transport burden. This practice helps maintain market access but squeezes profit margins.
Such discounts are generally calculated by factoring in transportation fees, quality variances (like sulfur content or density), and current market benchmarks, often resulting in a $1-4 per barrel reduction relative to global standards like Brent crude. Market participants, including traders, refiners, and producers, negotiate these based on real-time supply-demand and logistical realities, with benchmarks like the CPC Blend providing reference points.
International mechanisms, such as UN conventions granting transit rights and organizations like OPEC+ for quota management, promote fairer competition, though persistent disparities highlight the need for better infrastructure and diplomacy. Their global market share hovers around 3-4%, with trends showing stability or a mild decline as output from places like the US and Brazil surges.
Imagine a vast, resource-rich nation like Kazakhstan, tucked away in the heart of Central Asia with no coastline in sight, pumping out millions of barrels of oil each day yet struggling to get it to buyers without paying a steep price in logistics and politics.
This scenario captures the essence of the dilemmas faced by landlocked oil-producing countries as they navigate a global market dominated by coastal powerhouses. While the oil beneath their soil is just as valuable, the journey from wellhead to refinery often turns into a costly odyssey, shaping everything from pricing strategies to long-term economic viability. Let’s delve into this niche but crucial corner of the energy world, exploring the competitive disadvantages, pricing quirks, and evolving role of these inland players.
At the root of the problem is simple geography: without direct access to the sea, landlocked producers can’t load tankers straight from their shores. Instead, they rely on overland routes through neighboring countries, which means negotiating transit agreements, paying fees, and dealing with infrastructure that’s often outdated or insufficient.
Take transportation costs—these can be exorbitantly high, sometimes 50% above the global average for developing landlocked nations, according to analyses from organizations like the World Bank and UN.
For example, trucking oil through multiple borders invites delays from customs clearances, road quality issues, or even cartel-like controls in the logistics sector. Border bottlenecks alone can add days to transit times, making the oil less attractive to time-sensitive buyers.
Then there’s the political dimension: dependence on transit states exposes producers to risks like sudden fee hikes, pipeline shutdowns due to disputes, or outright blockades. In Africa’s Chad, for instance, oil flows through a pipeline to Cameroon’s coast, but any friction between the two can halt exports, as seen in past tensions.
Similarly, Central Asian giants like Kazakhstan route much of their output via Russia’s pipelines, leaving them vulnerable to geopolitical shifts, such as those amplified by recent global events. Coastal producers, by contrast, enjoy seamless access to international shipping lanes, allowing them to respond quickly to market demands and undercut prices if needed.

This disparity doesn’t just affect efficiency; it hampers overall development, with landlocked countries facing trade costs that stifle diversification and growth. Studies highlight how these nations, representing over 7% of the world’s population, grapple with isolation that keeps them “invisible” in global trade flows, as noted by UN trade experts.
* * *
Given these barriers, do landlocked producers really sell their oil at a discount to level the playing field? The short answer is yes, and it’s a pragmatic necessity rather than a choice.
The extra costs of getting the oil to market—transit fees, insurance for longer hauls, potential quality degradation during transport—mean that to compete, they must absorb some of that burden in the form of lower selling prices.
This brings their “netback” (the price after deducting transport) in line with what coastal sellers offer.
For analogy, consider Alberta’s oil sands in Canada, which, despite the country not being landlocked overall, face similar inland challenges and trade at deep discounts to benchmarks like West Texas Intermediate due to pipeline constraints.
In true landlocked cases, Kazakh CPC Blend crude, a light, sweet variety exported via the Caspian Pipeline Consortium to the Black Sea, often sells at $1-3 per barrel below Dated Brent, a key European benchmark. This discount reflects not just the pipeline tariffs but also the opportunity cost of alternative routes.
Azerbaijan’s Azeri Light, another Caspian export, follows suit, with prices adjusted downward to account for the Baku-Tbilisi-Ceyhan pipeline’s fees and distances.
In Africa, Chad’s Doba crude has historically traded at discounts to Mediterranean benchmarks, sometimes as much as $5-10 per barrel during volatile periods, to offset the 1,000+ kilometer pipeline to the Atlantic. Without these concessions, buyers would simply opt for easier-to-access oils from Saudi Arabia or Nigeria, leaving landlocked supplies stranded.
This pricing strategy ensures market entry but erodes revenues, forcing producers to pump more just to maintain income levels—a cycle that heightens environmental and economic strains.
* * *
How exactly is this discount figured out, and who calls the shots?
It’s not a fixed formula but a dynamic calculation rooted in market realities. Start with baseline costs: pipeline tariffs might run $3-5 per barrel for routes like Kazakhstan’s CPC line, plus freight from the terminal to the buyer. Quality plays a role too—many landlocked crudes are heavy or sour, requiring more refining, which buyers factor in as a $2-4 penalty. Then add location premiums: oils farther from major hubs like Rotterdam or Houston incur higher shipping, leading to further deductions.
Tools like Platts assessments provide daily benchmarks; for CPC Blend, the differential to Dated Brent might be minus $1.15 one day, widening to minus $3 during oversupply. Traders and refiners determine this through negotiations, auctions, or futures contracts on exchanges like ICE, where spreads between landlocked blends and global markers are traded.
Producers like state-owned KazMunayGas or international partners (e.g., Chevron in Kazakhstan’s Tengiz field) set initial offers, but ultimate prices emerge from supply-demand balance. In OPEC+ contexts, quotas influence volumes, indirectly affecting discounts—overproduction can flood markets and deepen cuts.
Ultimately, it’s the invisible hand of the market, informed by data from agencies like Argus or Platts, that sets the level, ensuring the oil remains viable despite the geographic handicap.
* * *
Is there a way for landlocked and coastal countries to compete fairly in this arena?
Mechanisms exist, but they’re imperfect and often under strain. The UN Convention on the Law of the Sea (Part X) grants landlocked states rights to transit through coastal neighbors for sea access, including for exports like oil, with principles of non-discrimination and reasonable fees.
This has enabled pipelines like Chad-Cameroon or the East African Crude Oil Pipeline for Uganda’s emerging output.
Bilateral and multilateral agreements further this: the Energy Charter Treaty promotes stable transit, while regional blocs like the Eurasian Economic Union facilitate flows for Central Asia.
OPEC+ includes landlocked members like Kazakhstan, allowing coordinated quotas to stabilize prices and prevent dumping. Global trade bodies like the WTO address unfair practices, though enforcement varies.
Investments in infrastructure—new pipelines, rail upgrades, or even tanker fleets on inland seas like the Caspian—help mitigate disadvantages, as seen in Kazakhstan’s efforts to diversify routes bypassing Russia. Yet, challenges persist: high debt in many landlocked developing countries limits funding for such projects, and external shocks like falling oil prices exacerbate vulnerabilities.
Resource-rich but isolated, these nations are pushing for digital trade enhancements and South-South cooperation to bridge gaps, turning barriers into opportunities through innovation.
* * *
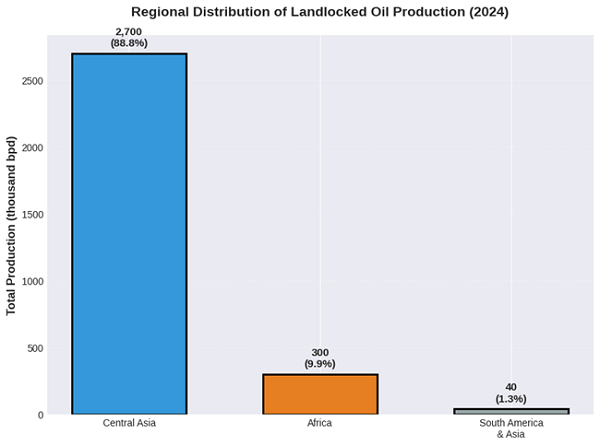
Turning to market presence, landlocked countries account for a small but notable slice of global oil production—around 3-4% based on recent estimates.
Key players include Kazakhstan (approximately 1.8 million barrels per day), Azerbaijan (0.6 million), Turkmenistan (0.27 million), and smaller contributors like South Sudan (0.1 million), Chad (0.13 million), Uzbekistan (0.03 million), Bolivia (0.02 million), and Mongolia (0.02 million), plus minor outputs from Europe and Africa.
This totals roughly 3 million barrels daily against a global crude output of about 82-83 million in 2024.
Over the years, their share has hovered in this range, showing stability with slight fluctuations.
From 2010 to now, Kazakhstan’s growth from 1.6 to 1.8 million bpd has offset declines in Azerbaijan (from 1 million to 0.6 million) and variability in conflict-affected areas like South Sudan. However, as non-landlocked leaders like the US (up to 13 million bpd via shale) and Brazil ramp up, the relative share of landlocked producers has edged downward, from perhaps 4% in the early 2010s to today’s levels.
Emerging fields, like Uganda’s projected 0.2 million bpd start in 2025, could nudge it up, but overall trends tie to commodity volatility and investment flows.
* * *
Beyond the basics, several factors make this topic richer for enthusiasts.
Diversification efforts are key: landlocked producers are increasingly exploring renewables or minerals to reduce oil dependence, with Kazakhstan targeting carbon neutrality by 2060 amid climate pressures.
Political risks amplify challenges—South Sudan’s 2024 pipeline halt due to Sudanese conflicts slashed output, underscoring fragility. Infrastructure innovations, like Kazakhstan’s tanker fleet on the Caspian, offer workarounds, while digital tools for trade monitoring cut delays.
Economically, high transit costs contribute to trade imbalances, with landlocked nations seeing export diversification lag; over 80% rely on raw commodities, exposing them to price swings.
Historical context adds depth: the post-Soviet boom in Central Asia boosted shares temporarily, but aging fields now demand tech upgrades like enhanced recovery. For investors, opportunities lie in pipeline projects or joint ventures, but risks from corruption or instability loom.
Environmentally, longer transport routes mean higher emissions, pushing calls for greener logistics. In sum, while landlocked oil producers punch above their weight in resilience, their story is one of adaptation in a sea-dominated world, blending economics, geopolitics, and ingenuity.
| Some figures are approximations or projections. Some are rounded. | |||
| Country | 2024 Oil Production (thousand bpd) | Share of Global (%) | Notes |
| Kazakhstan | 1,800 | 2.17 | Major exporter via pipelines; production up from 1,600 in 2010 |
| Azerbaijan | 600 | 0.72 | Declining from peak of 1,000 in 2010; BTC pipeline key |
| Turkmenistan | 270 | 0.33 | Stable; focus on gas but oil growing slightly |
| Chad | 130 | 0.16 | Reliant on Cameroon pipeline; steady output |
| South Sudan | 100 | 0.12 | Volatile due to conflicts; down from 150 in 2023 |
| Uzbekistan | 30 | 0.04 | Declining fields; minimal growth |
| Bolivia | 20 | 0.02 | Mostly gas; oil secondary |
| Mongolia | 20 | 0.02 | Emerging; rail exports to China |
| Others (e.g., Niger, Hungary) | 70 | 0.08 | Small-scale; limited impact |
| Total Landlocked | 3,040 | 3.66 | Stable share; global total ~83,000 thousand bpd |
| Global Total | 83,000 | 100 | Up from ~80,000 in 2010; driven by US, Brazil |
Categorized table of the citations, grouped by theme, with live links, publication dates where available, and brief notes on their contributions. This organization mirrors the article’s structure, making it easier for readers to dive deeper into specific aspects like economics or production stats:
| Theme | Source Description | Live Link | Publication Date | Key Contribution |
| Geographic and Economic Challenges | ResearchGate: Challenges Facing Landlocked Developing Countries | Link | Aug 8, 2025 | Discusses isolation, higher costs, and dependency on transit nations, foundational to understanding competitive disadvantages. |
| Geographic and Economic Challenges | World Bank: Landlocked Countries Higher Transport Costs | Link | Jun 16, 2008 | Highlights how uncertainty leads to pricier alternatives like air transport, exacerbating trade delays. |
| Geographic and Economic Challenges | Journal of African Economies: Challenges for Landlocked | Link | N/A | Reviews integration issues in Africa, including limitations from landlocked status. |
| Geographic and Economic Challenges | UN: Cost of Being Landlocked | Link | N/A | Explores multifaceted barriers like market access limitations and their economic impacts. |
| Pricing and Discounts | Oilsands Magazine: Differentials for Alberta Crude | Link | Dec 13, 2018 | Explains why inland crudes like WCS trade at discounts due to pipeline constraints. |
| Pricing and Discounts | Quora: US Refineries and Canadian Oil Discount | Link | Dec 7, 2024 | Attributes discounts to landlocked logistics and limited export capacity. |
| Pricing and Discounts | Oilsands Magazine: Alberta Crude Discounts | Link | Dec 13, 2018 | Details buyer dynamics reducing Alberta’s pricing power. |
| Pricing and Discounts | Library of Congress: Oil and Gas Pricing | Link | Aug 18, 2025 | Covers benchmarks used for valuing crudes based on quality and location. |
| Pricing and Discounts | Baird Maritime: CPC Blend Discounts | Link | Aug 11, 2025 | Analyzes narrowing discounts for Caspian blends amid market shifts. |
| Pricing and Discounts | Vortexa: CPC Blend Market Challenges | Link | May 15, 2025 | Focuses on export challenges and developments affecting CPC Blend pricing. |
| Policy and Fair Competition | UN: Unlocking Trade Potential of Landlocked | Link | N/A | Addresses commodity dependence and remoteness issues for LLDCs. |
| Policy and Fair Competition | World Bank: Improving Trade for Landlocked | Link | N/A | Analyzes constraints and priorities for enhancing LLDC trade. |
| Policy and Fair Competition | UNCTAD: Facilitating Participation of Landlocked | Link | N/A | Examines trade challenges and commodity reliance in LLDCs. |
| Market Share and Production Trends | Wikipedia: List of Countries by Oil Production | Link | N/A | Compiles EIA data on global oil production by country. |
| Market Share and Production Trends | Statista: Global Oil Production Share | Link | Jul 8, 2025 | Breaks down shares for top producers, including landlocked nations. |
| Market Share and Production Trends | Statista: Global Oil Production 1998-2024 | Link | Jul 2, 2025 | Tracks worldwide production trends over decades. |
| Market Share and Production Trends | EIA: Petroleum Liquids Supply Growth | Link | Feb 13, 2025 | Discusses global supply increases, driven by non-OPEC countries. |
| Country-Specific Production Data | CEIC: Kazakhstan Crude Oil Production | Link | N/A | Provides historical data up to 2023, showing recent increases. |
| Country-Specific Production Data | CEIC: Azerbaijan Crude Oil Production | Link | N/A | Tracks declines from previous highs. |
| Country-Specific Production Data | News Central Asia: Turkmenistan Oil Production | Link | Feb 12, 2025 | Details 2024 estimates and consumption. |
| Country-Specific Production Data | EIA: Sudan and South Sudan Oil | Link | N/A | Links intertwined oil sectors and economic roles. |
| Country-Specific Production Data | Trading Economics: Chad Crude Oil Production | Link | N/A | Reports stable output levels through 2025. |
| Country-Specific Production Data | Trading Economics: Uzbekistan Crude Oil Production | Link | N/A | Notes unchanging recent figures. |
| Country-Specific Production Data | Global Economy: Bolivia Oil Production | Link | N/A | Shows declines in recent years. |
| Country-Specific Production Data | Global Economy: Mongolia Oil Production | Link | N/A |
Key Citations:
ResearchGate: Challenges Facing Landlocked Developing Countries
World Bank: Landlocked Countries Higher Transport Costs
Journal of African Economies: Challenges for Landlocked
Oilsands Magazine: Differentials for Alberta Crude
Quora: US Refineries and Canadian Oil Discount
Oilsands Magazine: Alberta Crude Discounts
Library of Congress: Oil and Gas Pricing
UN: Unlocking Trade Potential of Landlocked
World Bank: Improving Trade for Landlocked
UNCTAD: Facilitating Participation of Landlocked
Wikipedia: List of Countries by Oil Production
Statista: Global Oil Production Share
Statista: Global Oil Production 1998-2024
CEIC: Kazakhstan Crude Oil Production
CEIC: Azerbaijan Crude Oil Production
News Central Asia: Turkmenistan Oil Production
EIA: Sudan and South Sudan Oil
Trading Economics: Chad Crude Oil Production
Trading Economics: Uzbekistan Crude Oil Production
Global Economy: Bolivia Oil Production
Global Economy: Mongolia Oil Production
Baird Maritime: CPC Blend Discounts
Vortexa: CPC Blend Market Challenges
EIA: Petroleum Liquids Supply Growth
UN: Cost of Being Landlocked
/// nCa, 2 October 2025